More than 57,000 Metro Manila Pedestrians Hit by Vehicles Since 2005
This is the third of a three-part series of data stories on road safety. Follow the links to the first and second installments:
- Part 1: When are you most in danger on the road?
- Part 2: What are the most crash-prone cities and streets in Metro Manila?
Being a pedestrian in Metro Manila isn’t easy. Sidewalks are non-existent in many places, and where they do exist, they are often dangerously narrow or full of obstructions. If you’re a pedestrian attempting to take the urban jungle by foot, what vehicles pose the greatest threat to your safety?
In the third installment of our ongoing road safety series, we’re looking at the types of vehicles that injure or kill the most pedestrians in Metro Manila.
In part 1 we looked at when you’re most likely to die on the road, and which vehicles tend to get in deadly or injurious accidents. In part 2, we identified the most dangerous cities and streets in Metro Manila for pedestrians, drivers and passengers.
This time, we’re looking at data spanning a period of over 10 years, from 2005 up to August 14, 2015. Once again, our data comes from the Metropolitan Manila Accident Reporting and Analysis System (MMARAS), provided to us by the MMDA’s Road Safety Unit.
But before we proceed, it's important to understand the numbers in this dataset are very likely underreported. Mr. Richard Domingo, the man who leads the MMDA Road Safety Unit's team of data gatherers and encoders, told us that this dataset is based on police blotter reports collected weekly from Metro Manila's police stations. Of course, not all traffic incidents get recorded in police blotters. Furthermore, a police officer who records a person as injured in a traffic incident may have no way of knowing whether that person later died from their injuries. There are probably more road fatalities than the data shows.
More pedestrians are hit by motorcycles than by any other kind of vehicle – and the numbers are rising
From 2005 up to August 14, 2015, there were 57,877 pedestrians injured or killed on Metro Manila roads. Of this number, 1,859 or 3.2% were killed, while 56,018 or 96.7% were injured. That’s a ratio of about one pedestrian killed for every 30 injured. A pedestrian is defined as a person who is travelling on foot and not riding a vehicle.
We looked at the number of pedestrians hit by different vehicle types since 2005. First, we limited our analysis to incidents in which at least one pedestrian was hurt or killed, and in which only a single vehicle was involved. It's not clear in incidents involving several vehicles which one actually hit the pedestrian victim. Anyway, the overwhelming majority (93.5%) of pedestrian victims were hurt in incidents only involving a single vehicle.
Pedestrians Hit by Vehicles 2005-2014
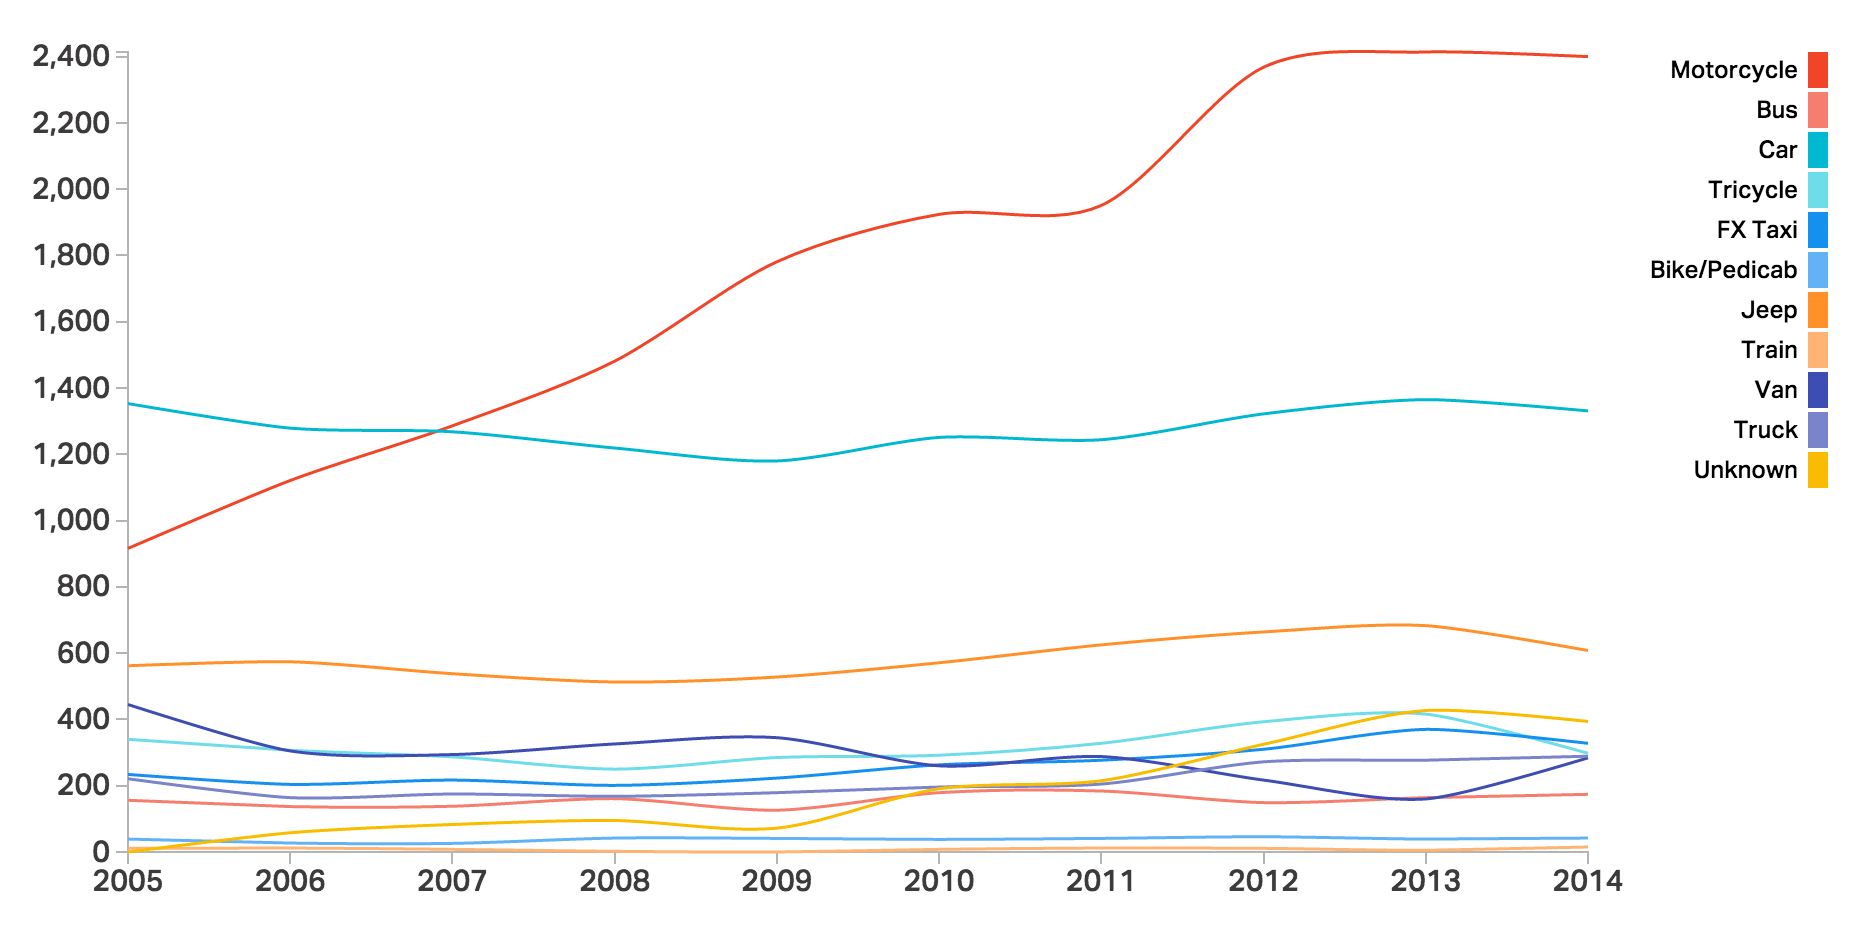
Over the past ten years, more pedestrians have been hit by motorcycles than by any other vehicle type. Furthermore, motorcycles are also the only vehicle type for which the number of pedestrians victims has been steadily rising. While other vehicle types hit about the same number of pedestrians each year, the number of pedestrians hit by motorcycles has grown by an average of 11 percent annually.
Why are more pedestrians being hit by motorcycles? First, the number of registered motorcycles has been on the rise throughout the country. The National Statistical Coordination Board (NSCB) noted that motorcycles and tricycles began to outnumber other registered utility vehicles in 2005, and by 2008 made up 48% of the vehicles on the road. In 2012, that proportion rose to 55% nationwide.
Motorcycles and pedestrians also tend to occupy the same marginalized portions of the road. Motorcycles sometimes ride on the sidewalks to avoid traffic. On roads where there are no sidewalks, pedestrians tend to walk along on the road’s shoulder or gutter, where motorcycles also pass. In these situations, collisions are bound to happen.
But cars are still more deadly – with trucks catching up
Does this mean that pedestrians should be more afraid of motorcycles than of larger vehicles like cars and trucks? Not necessarily.
While pedestrians are now more likely to be hit by motorcycles overall, most of these collisions only result in injury and not death. Only 1% of pedestrians that are hit by motorcycles are killed. Bigger vehicles still kill more pedestrians.
Pedestrians Killed by Vehicles 2005-2014
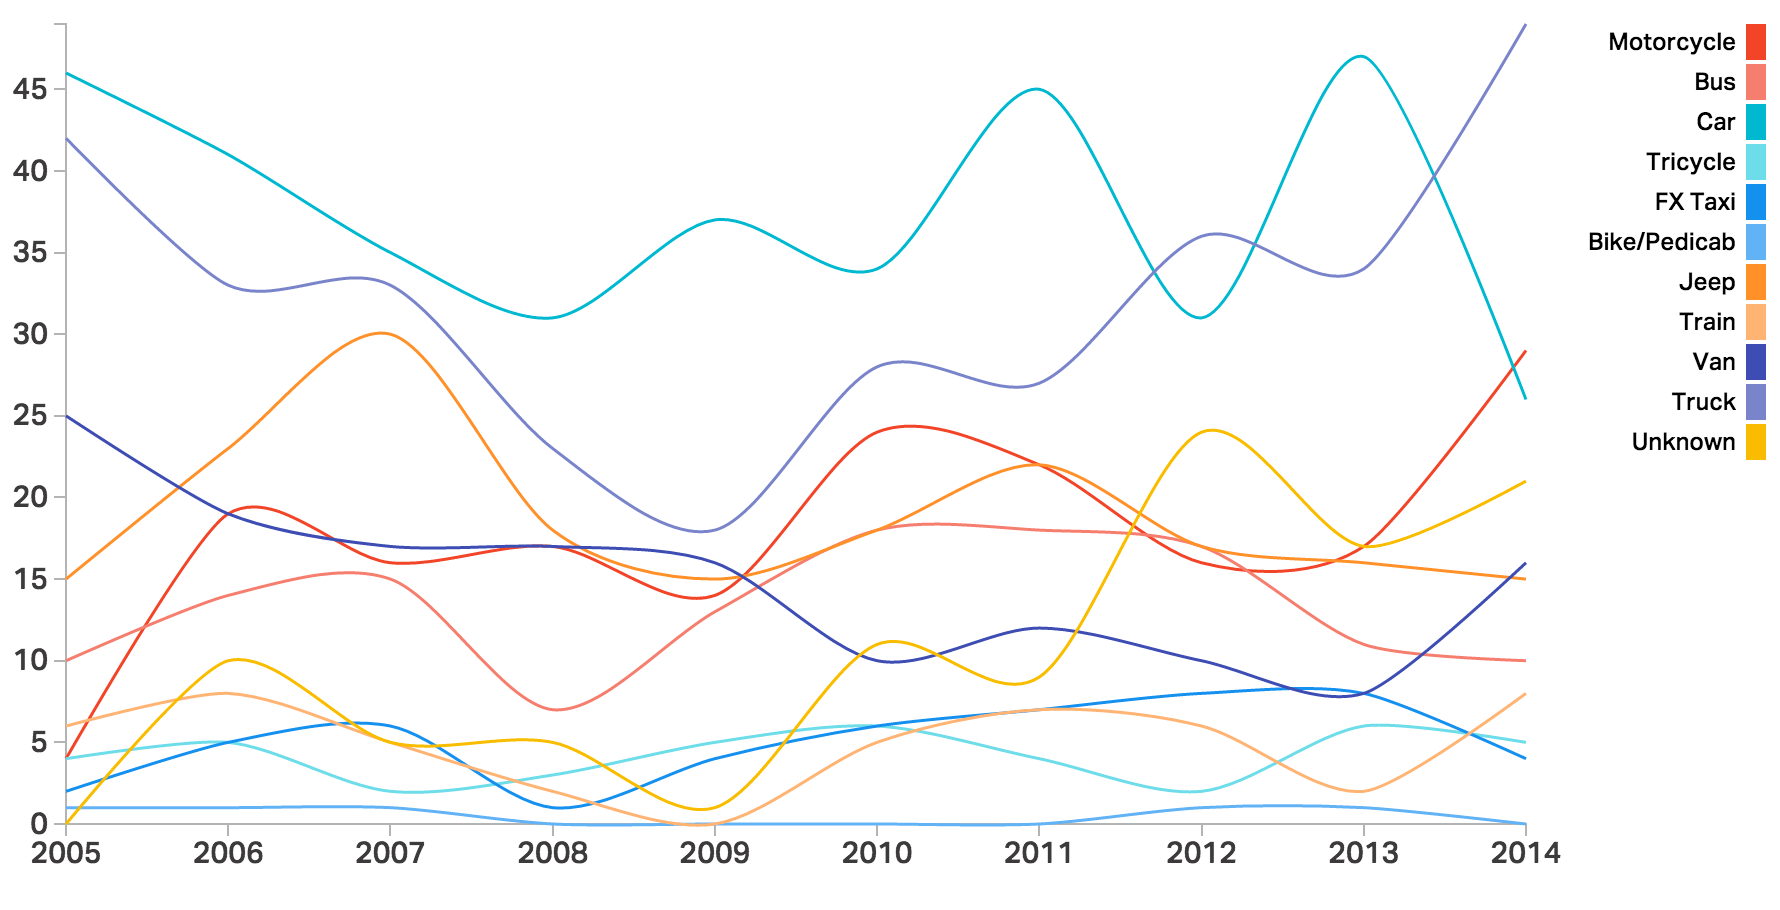
Between 2005 and August 14, 2015, more pedestrians were killed by cars than by any other vehicle type. But while the number of pedestrians killed yearly by cars has remained somewhat stable since 2005, the number of pedestrians killed by trucks has been on the rise since 2009, and in 2014 outnumbered those killed by cars. This is despite the fact that in total, cars hit nearly six times more pedestrians than trucks did. Trucks kill about 15 out of every 100 pedestrians that they hit, while cars kill 3 out of every 100. It’s also worth noting that last year was the first time more pedestrians were killed by motorcycles than by cars — though not by a big margin.
Here’s a table showing the total number of pedestrians killed and injured by vehicle type between 2005 and August 14, 2015:
Total Pedestrian Casualties by Vehicle Type
Based on MMDA data Jan. 1, 2005 - August 14, 2015
| Vehicle Type | Killed | Injured | Total | % Killed vs Total |
|---|---|---|---|---|
| car | 403 | 13,134 | 13,537 | 3.0% |
| truck | 341 | 1,935 | 2,276 | 15.0% |
| jeep | 200 | 5,955 | 6,155 | 3.2% | motorcycle | 193 | 18,586 | 18,779 | 1.0% | van | 159 | 2,910 | 3,069 | 5.2% | bus | 142 | 1,526 | 1,668 | 8.5% | unknown vehicle | 114 | 1,886 | 2,000 | 5.7% | train | 58 | 38 | 96 | 60.4% | fx/taxi | 53 | 2,717 | 2,770 | 1.9% | tricycle | 44 | 3,323 | 3,367 | 1.3% | bike/pedicab | 5 | 396 | 401 | 1.2% |

Are pedestrian deaths and injuries underreported in media?
But let’s zoom out to the bigger picture. If you add all the pedestrians killed by various vehicle types over the years, they comprise nearly half of the road deaths in Metro Manila. To be exact, pedestrians made up the 46.2% of Metro Manila’s 4,024 road fatalities since 2005. That’s more than the number of drivers (39.8%) or passengers (14%) that were killed.
his rate is much higher than elsewhere in the world. The World Health Organization reports that worldwide, pedestrians make up 22% of road traffic deaths — less than half Metro Manila’s rate.
Given the magnitude of the problem, does pedestrian safety get the public attention it deserves?
Last year, our team also helped conduct an analysis of Philippine media coverage on road safety in for the NGO HealthJustice and the World Health Organization. We scraped thousands of articles containing keywords on land transportation and road safety from three major Philippine news websites — GMA News Online, ABS-CBN News, and Inquirer.net. We found that less than 5% of the road crash victims mentioned in these news reports were pedestrians. In short, the proportion of attention pedestrian victims get in mainstream media doesn’t match the proportion of pedestrians that are hurt or killed in Metro Manila.
Of course, a single pedestrian getting injured by a single motorcycle or car may not be newsworthy. But when the numbers add up — and they do — then maybe it should be news.
We hope that drawing attention to the dangers that pedestrians face will open a discussion about how to make streets safer and more livable for everyone.
Enjoyed this data story? Want to supercharge your content marketing strategy with data? Send us an email at [email protected]
If you have any interesting questions about this dataset, tweet us @thinkdatasci to get some answers!


