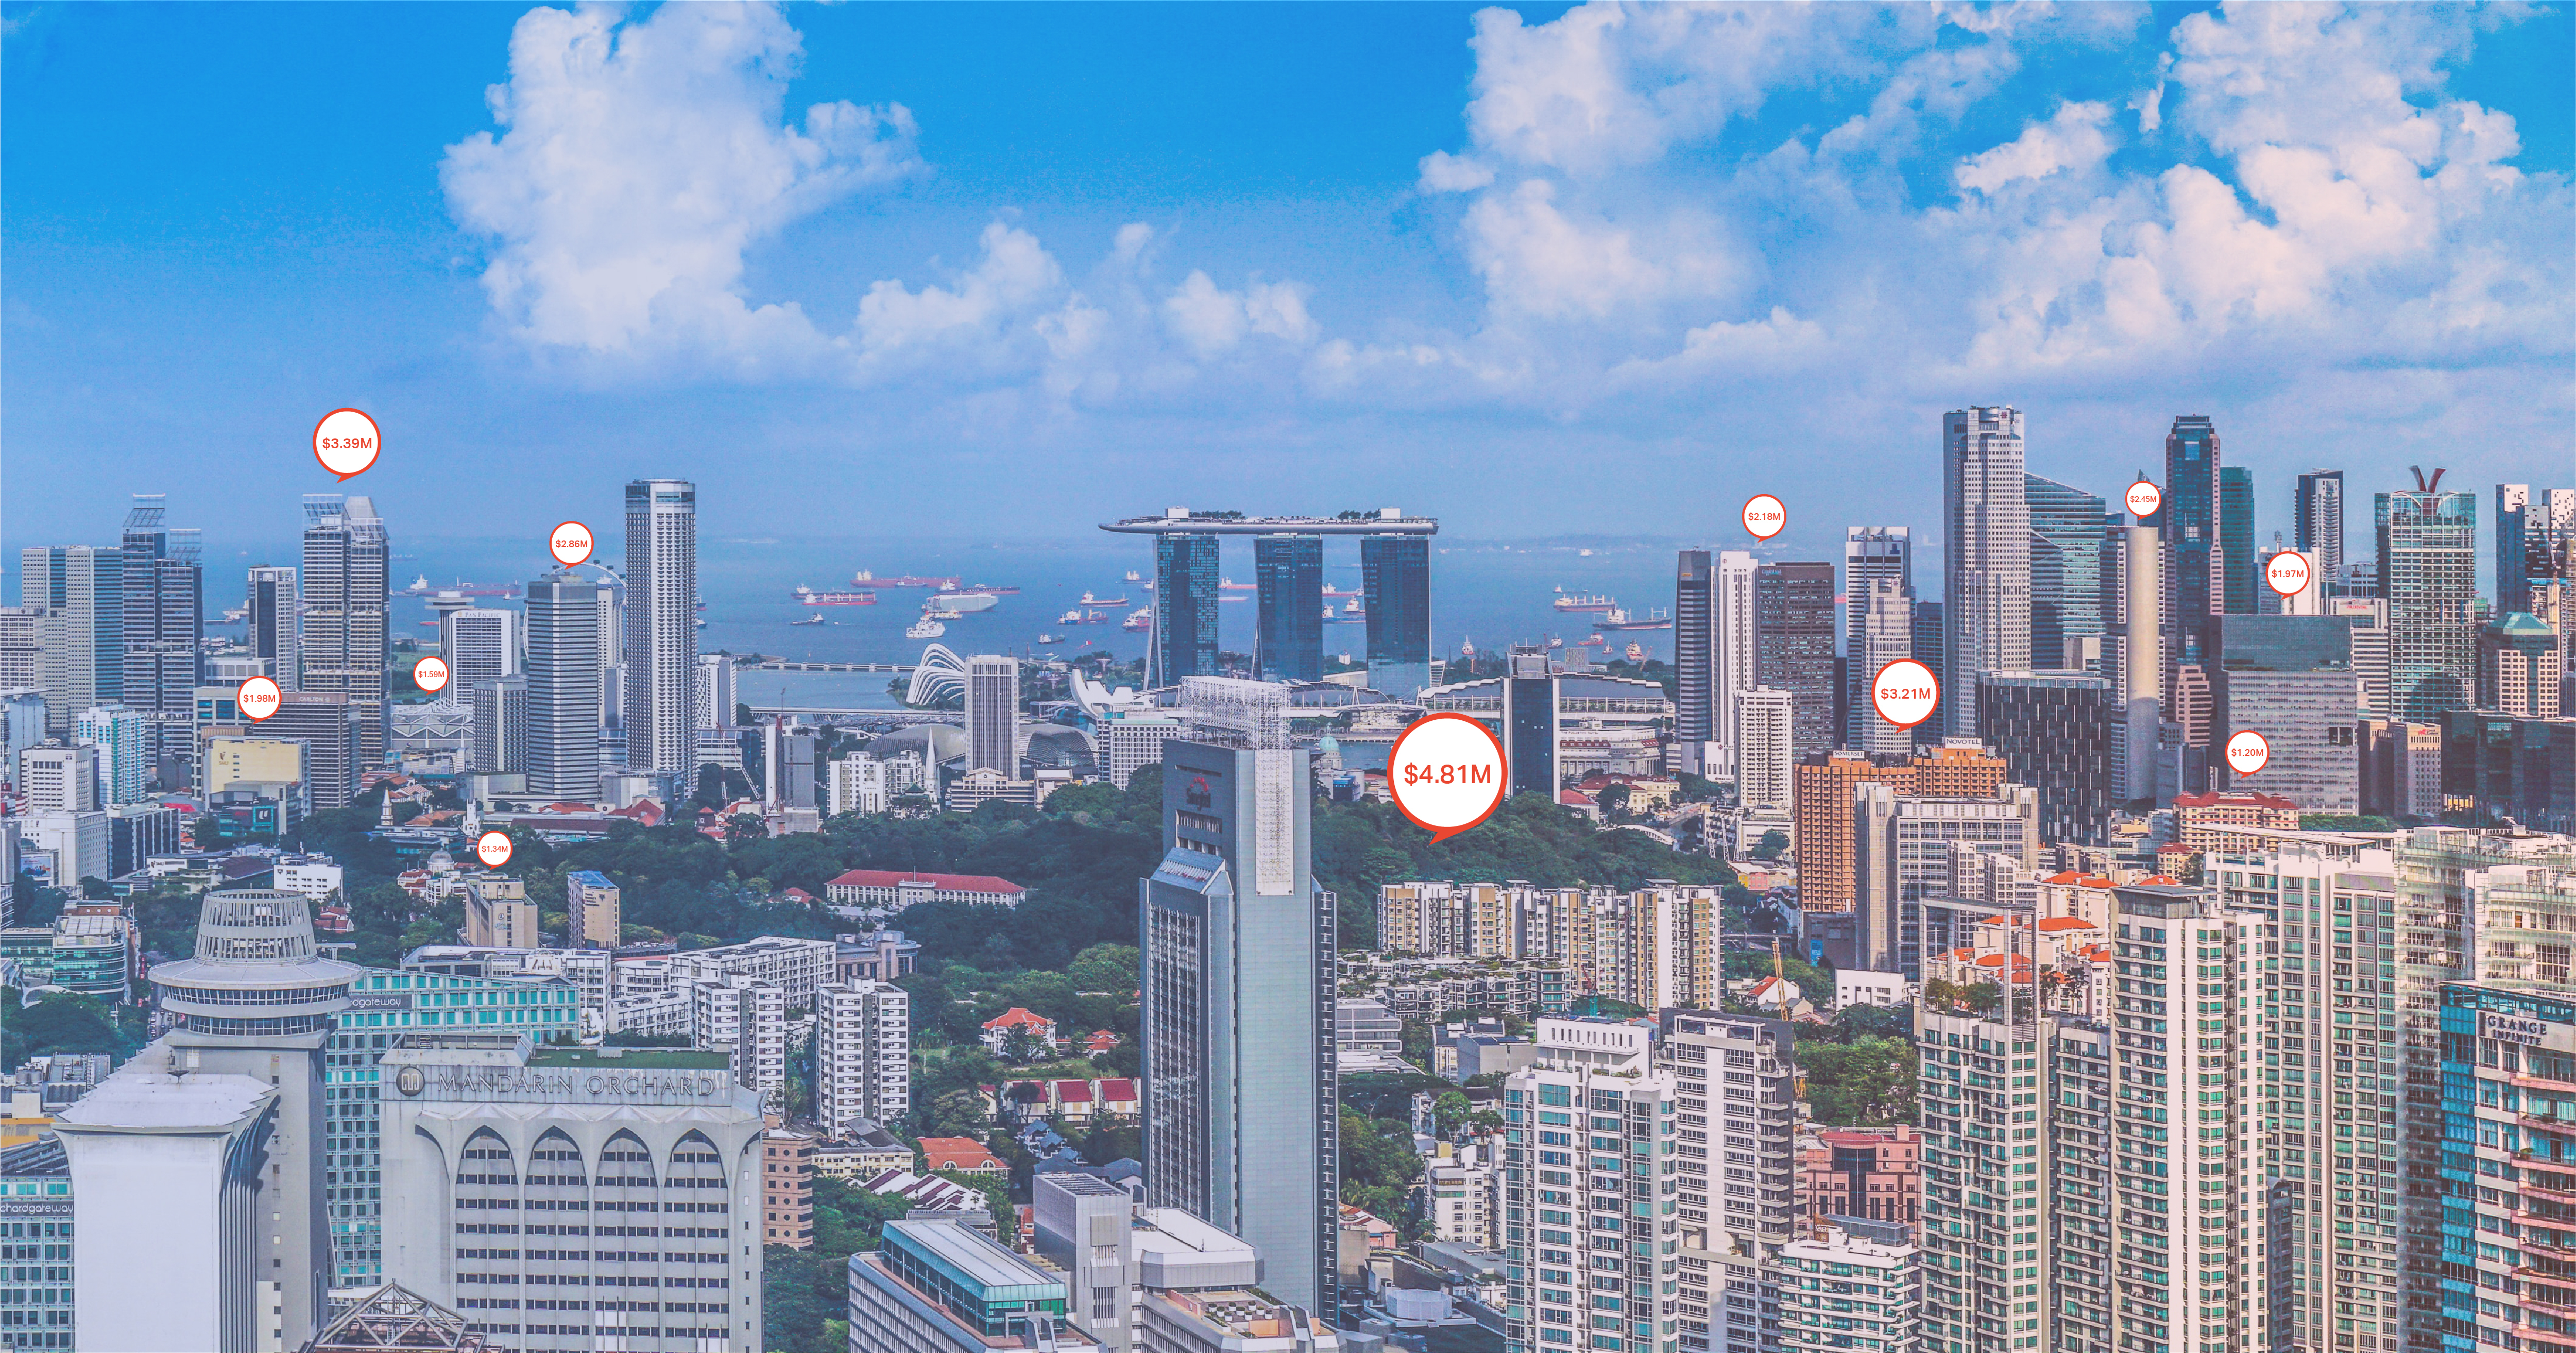
Quarantine in a Multicultural Hub: Exploring Mapbox Movement in Singapore
Last June, Mapbox gave us access to Movement, a dataset which contains telemetry information based on app interactions for users in Singapore.
With this anonymized dataset, we can observe movement patterns of large groups of people across different areas by looking at the activity levels down to 150m x 150m grids.
Using these observations, we explore the level of compliance to lockdown measures during Singapore’s COVID-19 outbreak. By plotting this mobility data, we can visually distinguish drops in activity around commercial and residential areas throughout the country.
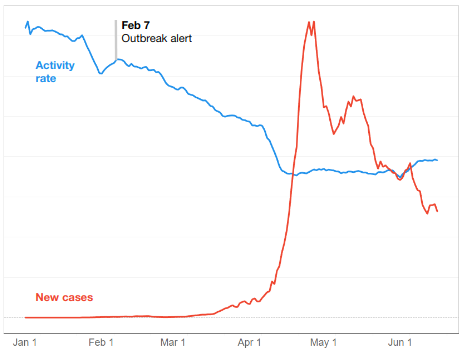
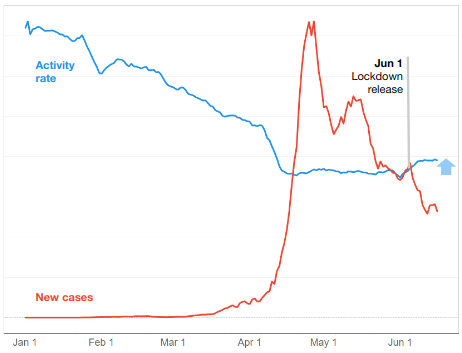
Movement drops by 23% after outbreak alert
Nationwide activity decreased up to its lowest point pre-lockdown on April 6. The decrease began when the government issued an outbreak alert on February 7, specifically the Orange DORSCON level, which alerted the public of the high infection risk of COVID-19. This was 2 months before the peak of the virus in April[1].
Rising public concern caused a steady decrease in activity, wherein otherwise bustling areas experienced much less foot traffic. During this time also, the government enforced crowd reduction in malls and restaurants [2].
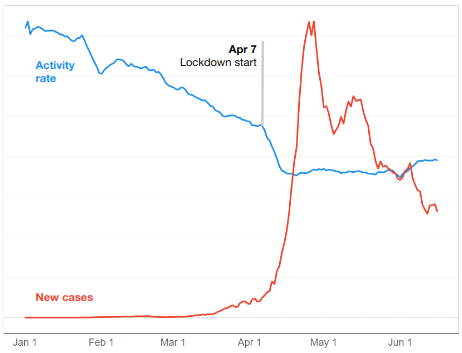
And -20% more after lockdown is announced
On April 7, Singapore initiated nationwide lockdown through a program called the Circuit Breaker. This caused a further drop in activity which reached its lowest point on April 20. Non-critical businesses, tourist, and entertainment venues in the central area were required to close down [3].
In the map, we can see the decrease in activity spreading into more areas like Punggol and Geylang in the east.
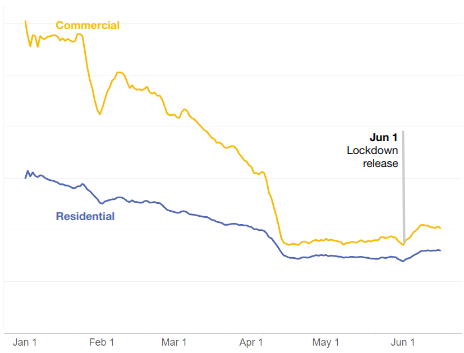
Bustling city centers were largely affected
Before the Circuit Breaker, areas with shops and restaurants are usually brimming with activity, such as here in Downtown Core, Singapore’s main commercial area. Nearby areas like the famous Marina Bay Sands and Gardens by the Bay are also frequented by tourists far and wide.
After the Circuit Breaker was announced, these same areas experienced a sudden drop in activity. Noncritical businesses like tourist and entertainment venues all over Singapore were required to close down [3]. Besides Downtown, other largely affected areas include neighboring Orchard, Museum, and Outram.
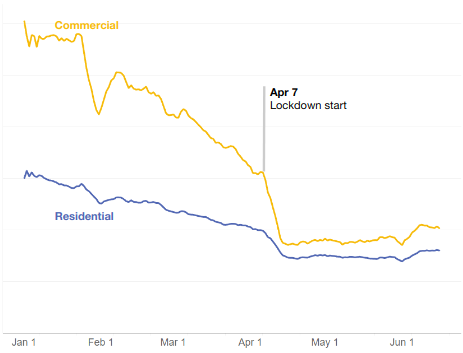
Residential areas retained activity
Pre-lockdown, residential areas were places of concentrated activity as well, with people living in neighborhoods of high-rise condominiums. Resident activity reflects in telemetry data through activities like checking the weather and using apps to navigate to destinations.
With people staying at home during the Circuit Breaker, activity greatly went down while remaining concentrated within the vicinity of residential buildings, as shown here in Yishun. Following concerns on the virus and proximity to worker dorms, more people opted to remain indoors and use delivery apps [4] to address basic needs such as food and toiletries. Other residential districts that retained activity included Woodlands, Punggol, and Pioneer.
Resumption after lockdown was slow and distributed
Following the end of the Circuit Breaker on June 1, movement across Singapore increased by +6%. During this time also was the gradual resumption of operations per industry. [5]
Although still far from pre-covid activity levels, areas around Singapore are starting to recover such as the Central area in the south and areas like Punggol and Geylang in the north east.
Commercial areas recovered fastest
For example near Orchard Road, activity went up the most right after the lockdown release, with people heading back to their jobs in shops and offices in the area.
Some of the most recovered as well are the surrounding areas Downtown, Newton, and Museum, which together comprise Singapore's ever-busy Central Area.
Using mobility data, we have observed decreases and recoveries in mobility in response to various government mandates during the outbreak.
We see the applications of this type of data as a way to monitor crises in specific locations at a very granular level. With Mapbox having over 700 million active users worldwide[6], this analysis can be applied to any location in the globe, with the same level of granularity.
Interested in using mobility data for your use case? Contact us below or send a message to our friends at Mapbox!
References:
[1] Coronavirus: Singapore ups outbreak alert to orange as more cases surface with no known links; more measures in force; from https://www.straitstimes.com/singapore/coronavirus-outbreak-alert-upped-to-orange-as-more-cases-surface-with-no-known-links-more
[2] Coronavirus: All entertainment venues in Singapore to close, gatherings outside work and school limited to 10 people; from https://www.straitstimes.com/singapore/health/all-entertainment-venues-in-singapore-to-close-gatherings-outside-work-and-school
[3] PM Lee Hsien Loong on the COVID-19 situation in Singapore; from https://www.pmo.gov.sg/Newsroom/PM-Lee-Hsien-Loong-on-the-COVID19-situation-in-Singapore-on-3-April-2020
[4] Reasons of using food delivery apps more often during COVID-19 pandemic https://www.statista.com/statistics/1148008/singapore-reasons-using-food-delivery-apps-more-during-covid-19/
[5] Tightened circuit breaker measures extended for another week; some activities allowed to resume from May 5; from https://www.straitstimes.com/singapore/some-singapore-businesses-to-reopen-from-may-5-as-circuit-breaker-measures-eased
[6] Mapbox Fact Sheet; from https://www.mapbox.com/about/company#fact-sheet
For the difference maps, we display the difference between the Monday right after the event, and the average of January mondays (pre-covid)