When are you most in danger on the road?
This is the first of a three-part series of data stories on road safety. Follow the links to the second and third installments:
- Part 2: What are the most crash-prone cities and streets in Metro Manila?
- Part 3: 57,000 pedestrians hit by vehicles in Metro Manila since 2005
Do you personally know someone who has been hurt or even killed in a road accident?
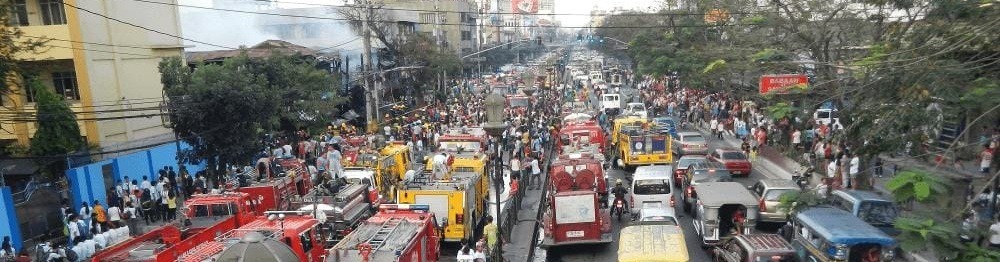
Road accidents are so commonplace, we view them as an inevitability of city living – an unavoidable fact of life, like old age or illness. But there’s a difference between accidents that scratch up a car, and accidents that end with you or your loved ones in the hospital.
During the project, we learned that road crashes are quickly becoming a leading cause of death and injury in developing countries, including the Philippines.
A growing health crisis
Recently our team worked on a data analysis project for the World Health Organization about road safety. During the project, we learned that road crashes are quickly becoming a leading cause of death and injury in developing countries, including the Philippines.
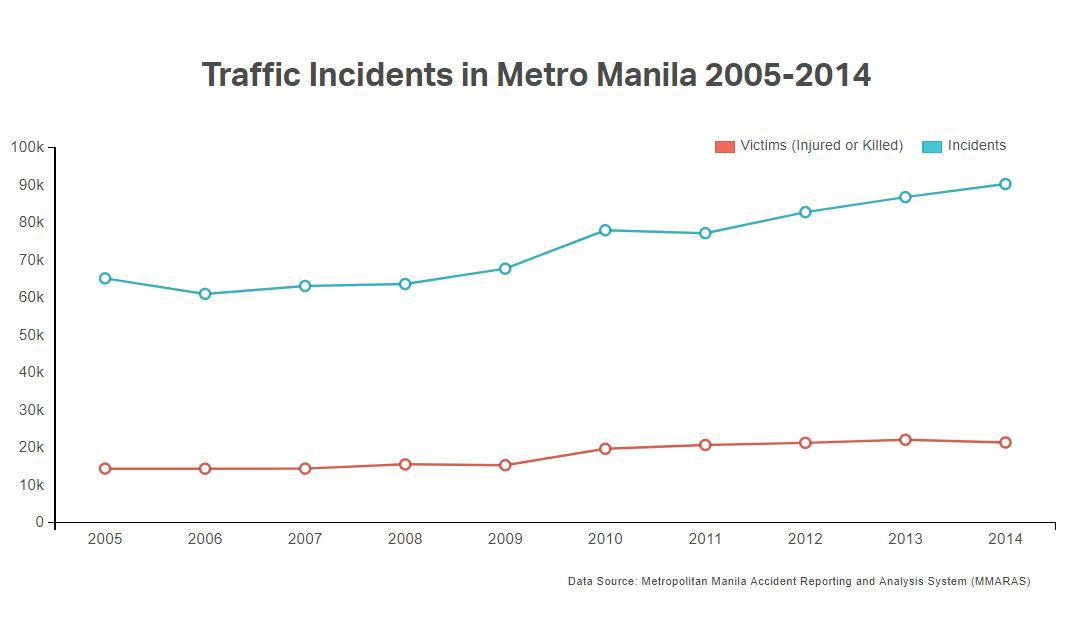
Traffic Incidents in Metro Manila 2005-2014
An estimated 8,499 Filipinos die every year in road crashes, and the numbers are growing yearly.1 If nothing is done to address the problem, the Department of Transportation and Communication predicts around 300,000 Filipinos — roughly equivalent to the population of Mandaluyong — will have died on Philippine roads between 2010 and 2020.
Development organizations like the World Health Organization and World Bank have identified traffic-related deaths and injuries as a full-blown public health crisis, like cancer or HIV/AIDS.
Predictable is preventable
If road users understand what types of travel are predictably riskier than others, they can take extra precautions when they find themselves in dangerous road situations. Authorities can also focus manpower and resources on preventing the types of incidents that are far more likely to end tragically.
Our team managed to get our hands on one of the most complete datasets on traffic incidents in Metro Manila, the Metro Manila Accident Recording and Analysis System or MMARAS. Maintained by the Metro Manila Development Authority or MMDA, this database contains information on 90,258 traffic incidents that took place in Metro Manila in 2014.
Of these incidents, over 81 percent — the vast majority — only resulted in damage to property. Around 18.5 percent of the incidents recorded at least one injured person, while just 0.4 percent of incidents were fatal, or resulted in at least one death. However, the number of fatalities is almost certainly underreported, mainly counting victims who died on the spot. It’s very likely that some of the victims reported as injured may have later been brought to the hospital and died from their injuries.2
How likely is it that if you get in an accident on your daily commute, it will result in someone getting hurt or killed?3 We calculated for the “casualty likelihood” of different types of incidents based on various factors — such as time of day, day of the week, and types of vehicles involved.
Pre-dawn road crashes were 3x more likely to end in injuries or death.
The most interesting nuggets our team found are as follows:
- Pedestrians made up 44% of fatalities.
- Pre-dawn road crashes were 3x more likely to end in injuries or death.
- Motorcycles are among the most vulnerable forms of transportation.
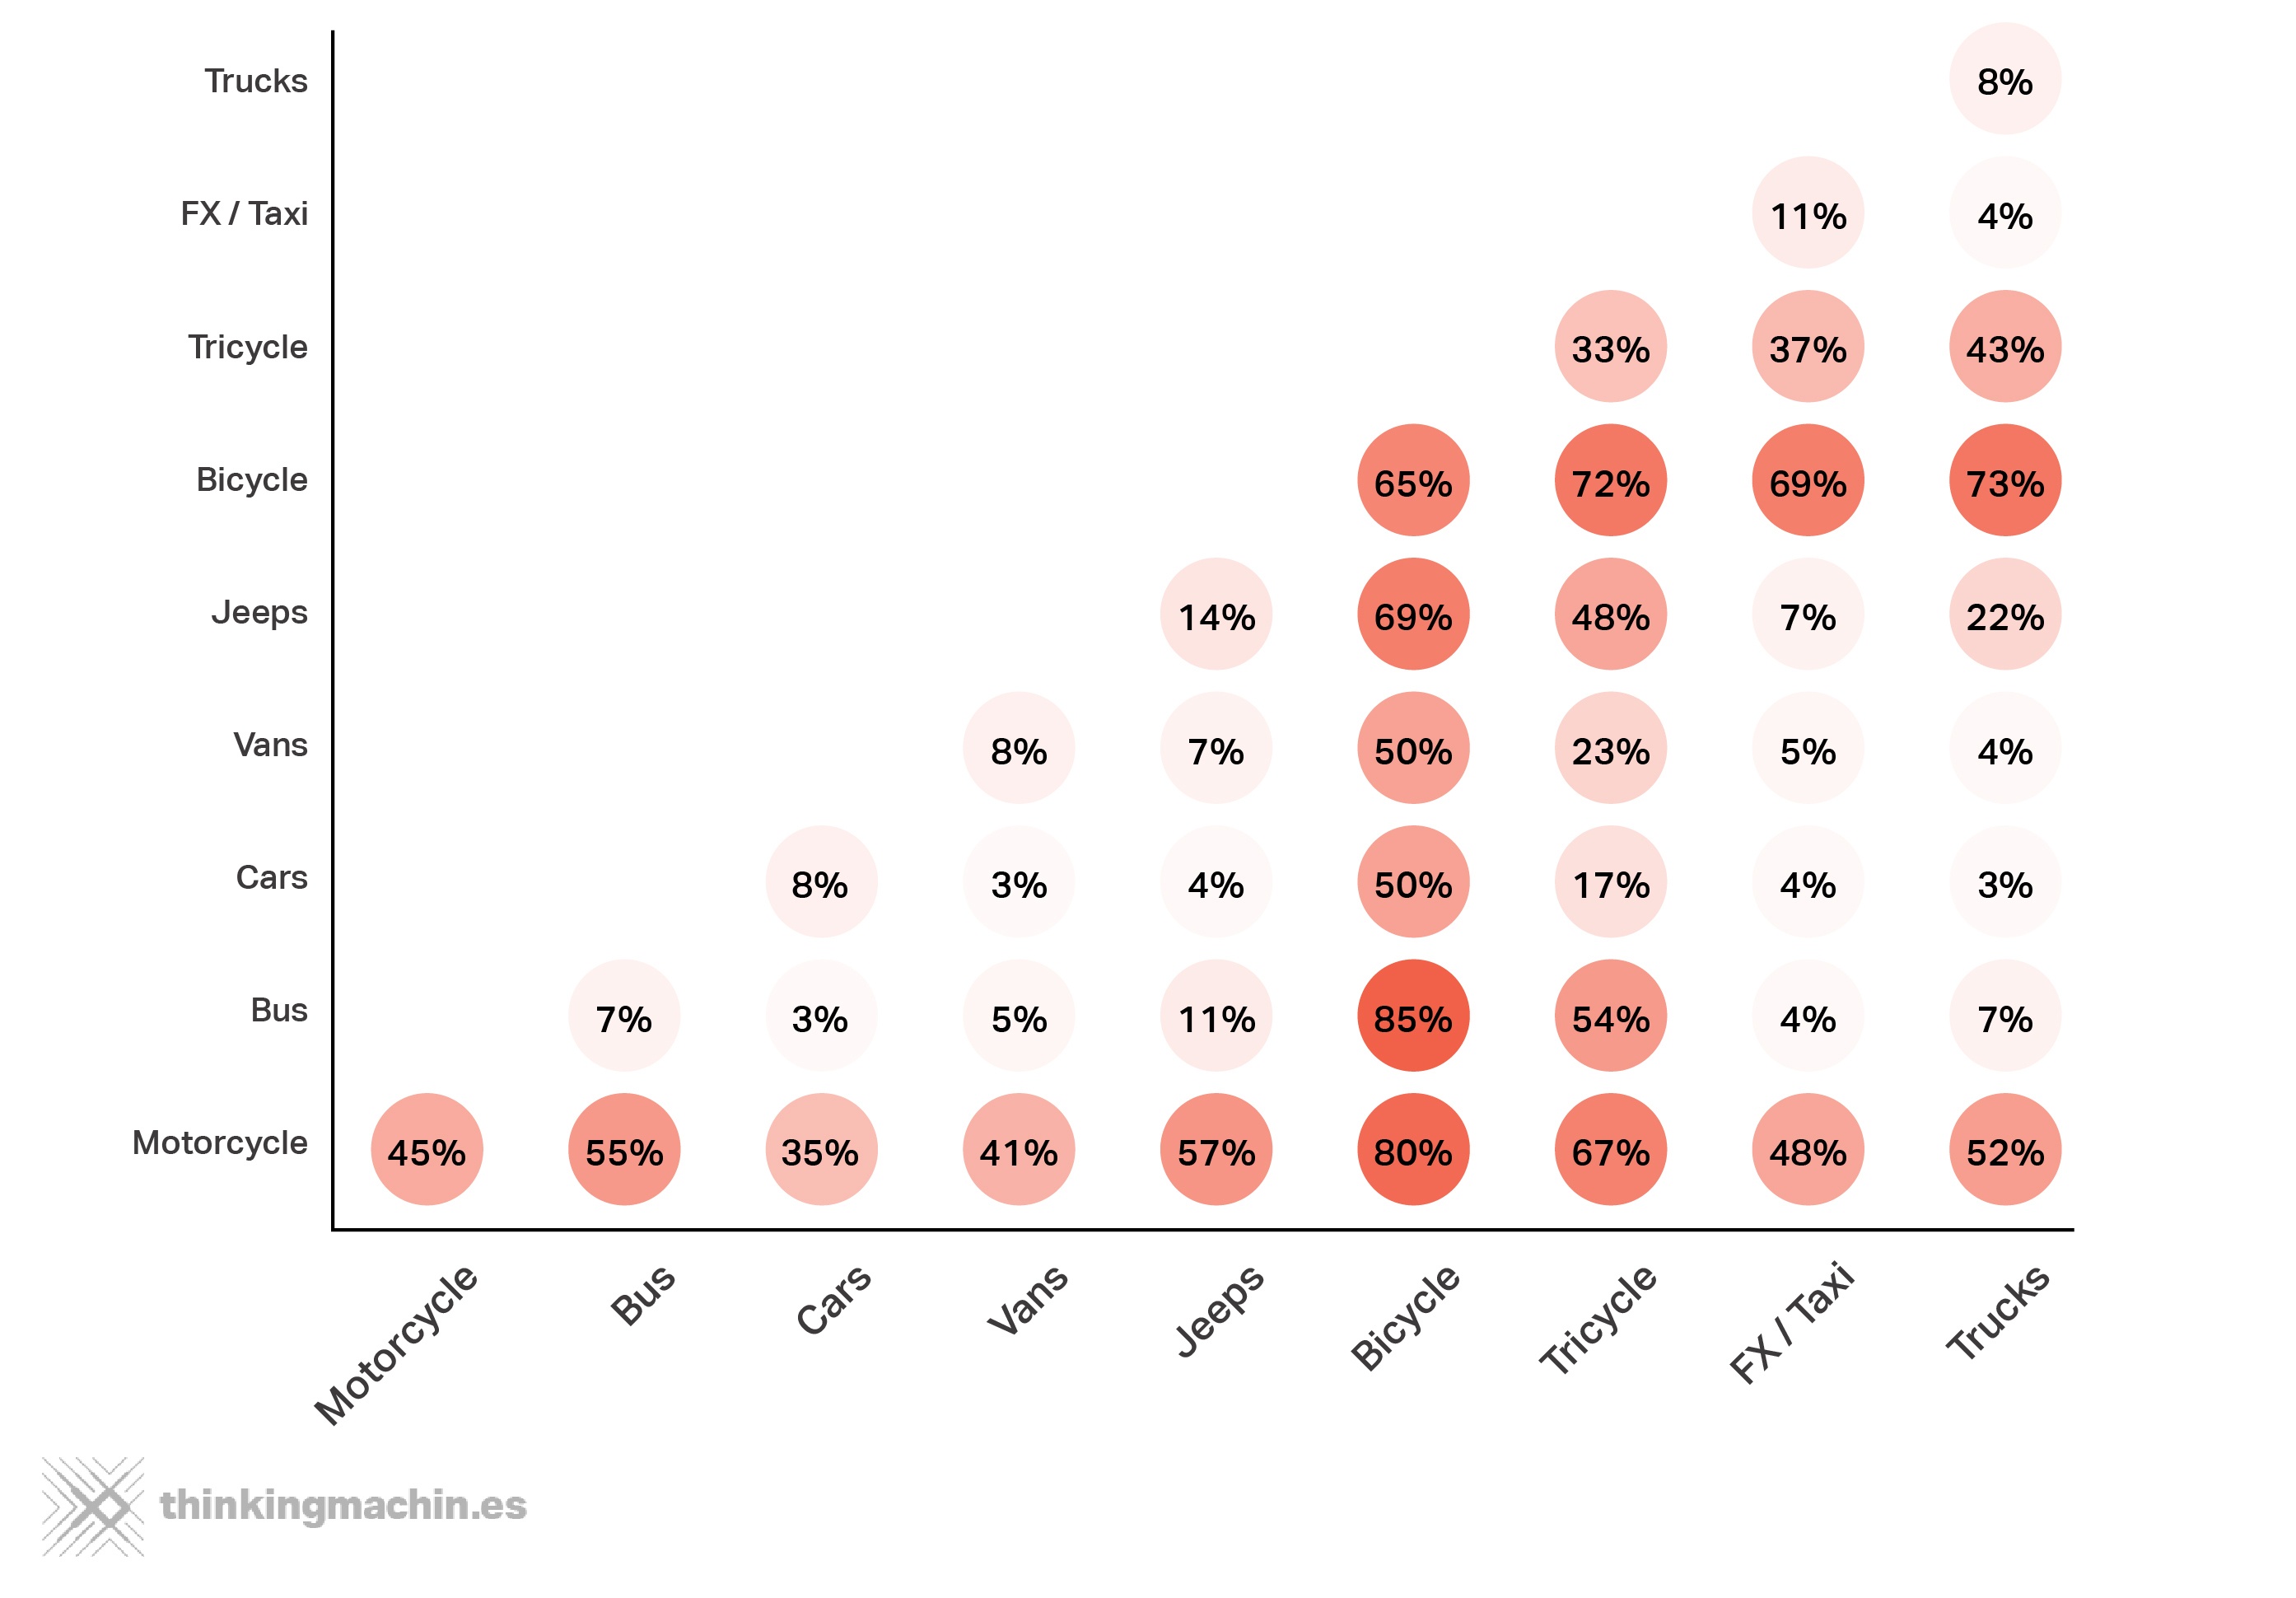
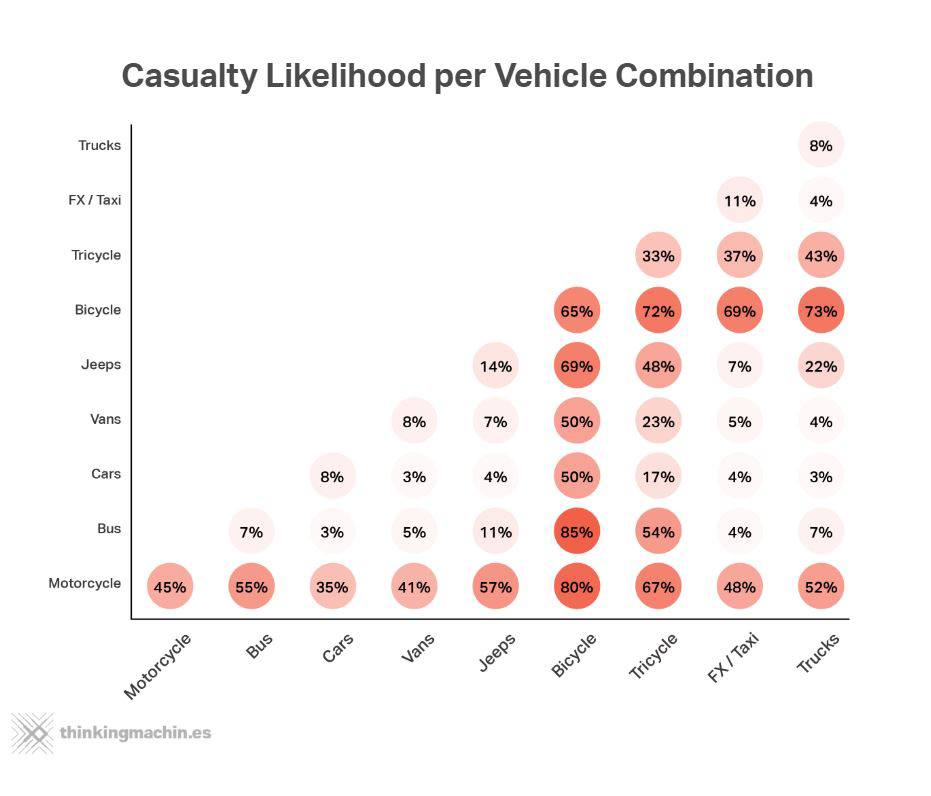
- An accident involving both a truck and a bicycle results in injury or death 80% of the time.
An accident involving both a truck and a bicycle results in injury or death 80% of the time.
Pedestrians made up 44% of fatalities
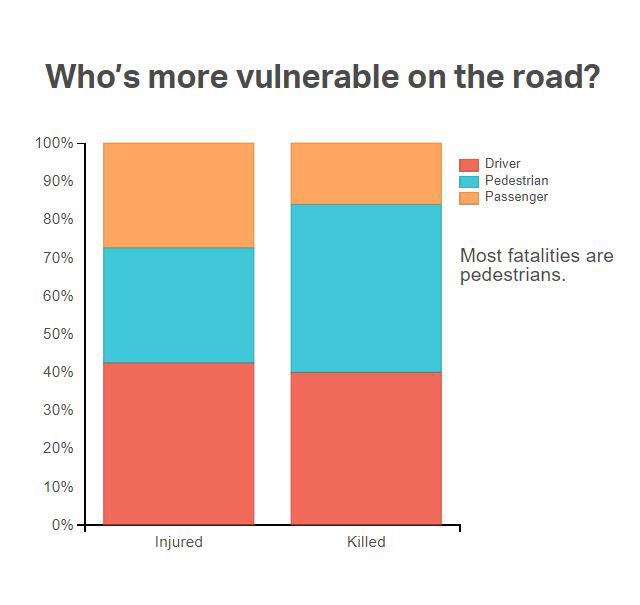
In 2014, there were 443 people killed and 20,899 people injured on Metro Manila roads. Pedestrians comprised 44% or nearly half of the fatalities, while drivers and passengers comprised 40 and 16 percent.
(Read: More pedestrians hit by motorcycles than by cars in Metro Manila since 2005)
Among the injured, 42 percent were drivers, followed by pedestrians at 30 percent and passengers at 27 percent.
Who’s more vulnerable on the road?
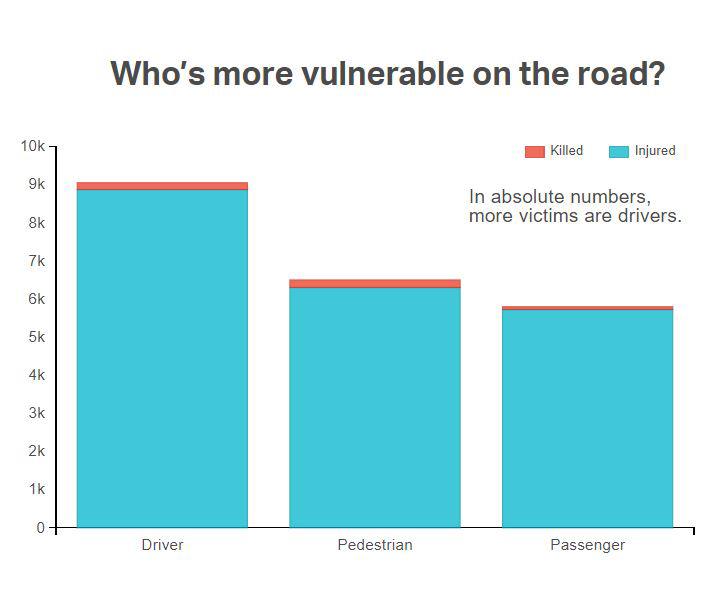
While just around 1.7 percent of drivers and passengers who figure in accidents actually get killed, the ratio rises to 3 percent for pedestrians.
While just around 1.7 percent of drivers and passengers who figure in accidents actually get killed, the ratio rises to 3 percent for pedestrians.
Who’s more vulnerable on the road?
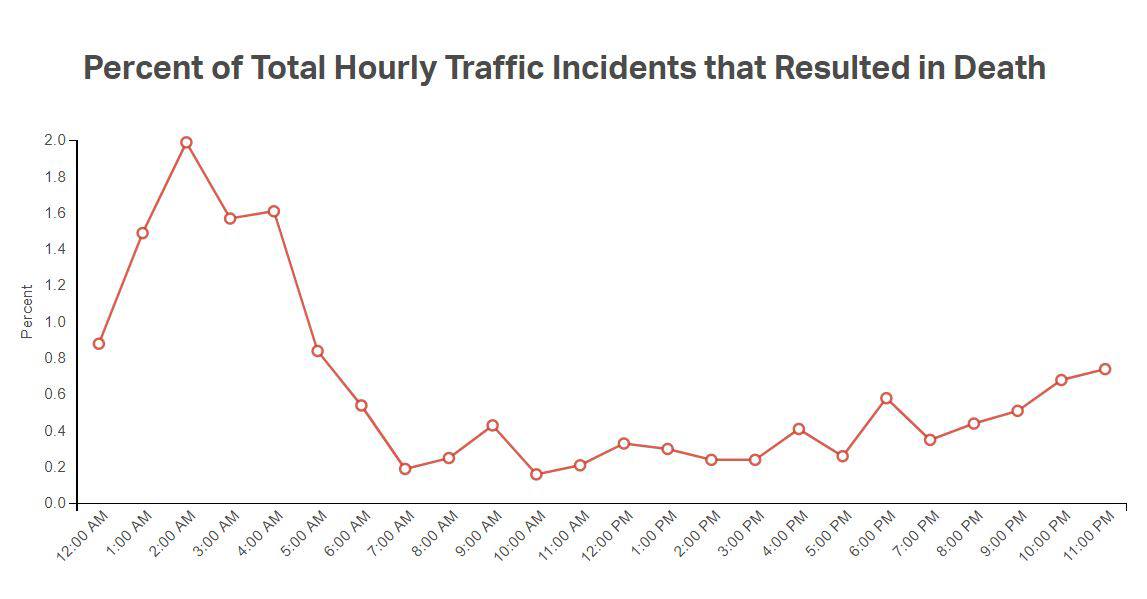
Pre-dawn road crashes were up to 3 times more likely to be deadly
Road crashes that happened between 1:00 AM and 5:00 AM were two to three times more likely than average to be fatal or result in at least one death. Around two out of every 100 road crashes that occurred between 2:00 and 3:00 AM resulted in at least one death, while only 0.25 percent of incidents that happened between 10:00 and 3:00 PM were fatal.
Percent of Total Hourly Traffic Incidents that Resulted in Death
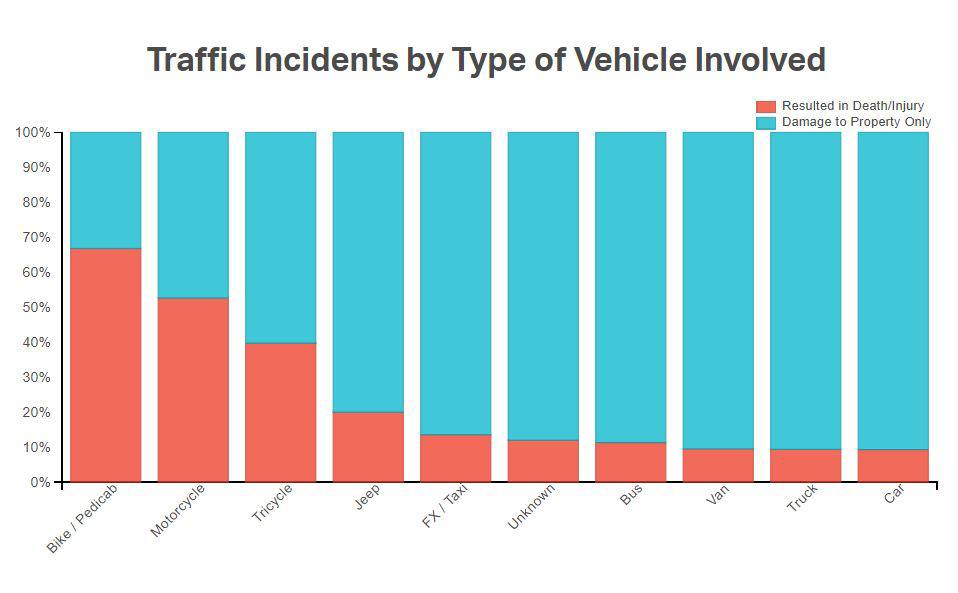
Two- and three-wheeled vehicles are the most vulnerable
The fewer wheels a vehicle has, the more vulnerable it is on the road. Over half of all traffic incidents involving either a motorcycle or a bicycle resulted in injury or death, versus fewer than 10 percent of incidents involving four-wheeled vehicles like vans, trucks, and cars.
Traffic Incidents by Type of Vehicle Involved
While bicycle and motorcycles riders are most at risk, their chances of getting hurt or killed rise when they come into contact with larger vehicles. If you’re riding a bicycle and you get into an accident with a bus, there’s an near 85% chance that somebody is going to be killed or hurt. Incidents involving bicycles and motorcycles aren’t far behind with a casualty likelihood of 80.25%, followed by trucks and bicycles at 73%.
Casualty Likelihood per Vehicle Combination
Footnotes:
- World Health Organization 2010 data annual road traffic deaths
- The World Health Organization defines road crash fatalities as anyone who dies within 30 days of being injured in a road crash.
- While we also wanted to calculate for the likelihood that an accident will take place to begin with, there’s a missing piece here. We’d need to know how many trips are taken every day in Metro Manila that don’t result in accidents, information that as of now we don’t have.