Using Transfer Learning and Satellite Imagery to Map Poverty in the Philippines
Mapping the distribution of poverty is essential for policy makers and humanitarian organizations to formulate programs and aids targeted at vulnerable groups. However, one major challenge in fighting poverty today is the lack of reliable socioeconomic data, which is highly expensive, time-consuming, and labor-intensive to collect. Conducting on-the-ground surveys can cost tens of millions of pesos and are usually done only every three to five years at the regional or provincial level.
With the rapid advancements in computer vision research as well as an increasing availability of satellite imagery, we aim to overcome this problem by using a combination of machine learning and geospatial information as a low-cost and robust way to provide reliable estimates of poverty during periods without sufficient census data.
In particular, we adopt the methods described in a study by Jean et. al. from the Stanford University Sustainability and Artificial Intelligence Lab, in which they were able to reconstruct asset-based wealth measures for five different Sub-Saharan African countries using satellite imagery and nightlights data. Similarly, we developed a preliminary poverty prediction model for the Philippines in line with the UN’s Sustainable Development Goals through the help of the UNICEF Innovation Fund.
Shedding Light on Philippine Poverty
Poverty and human development can measured in many different ways. In our work, we used wealth estimates collected through the 2017 National Demographic and Health Survey. This nationwide survey was implemented by the Philippine Statistics Authority from August to October 2017 and covered over 31,000 households in over 1,200 locations across the Philippines.
The survey estimated a “wealth score” for each household based on attributes such as their roof material, access to water and electricity, whether they owned different types of appliances or vehicles, and others. These household wealth scores were then averaged per location and scaled so that values closer to 1 indicate greater wealth.
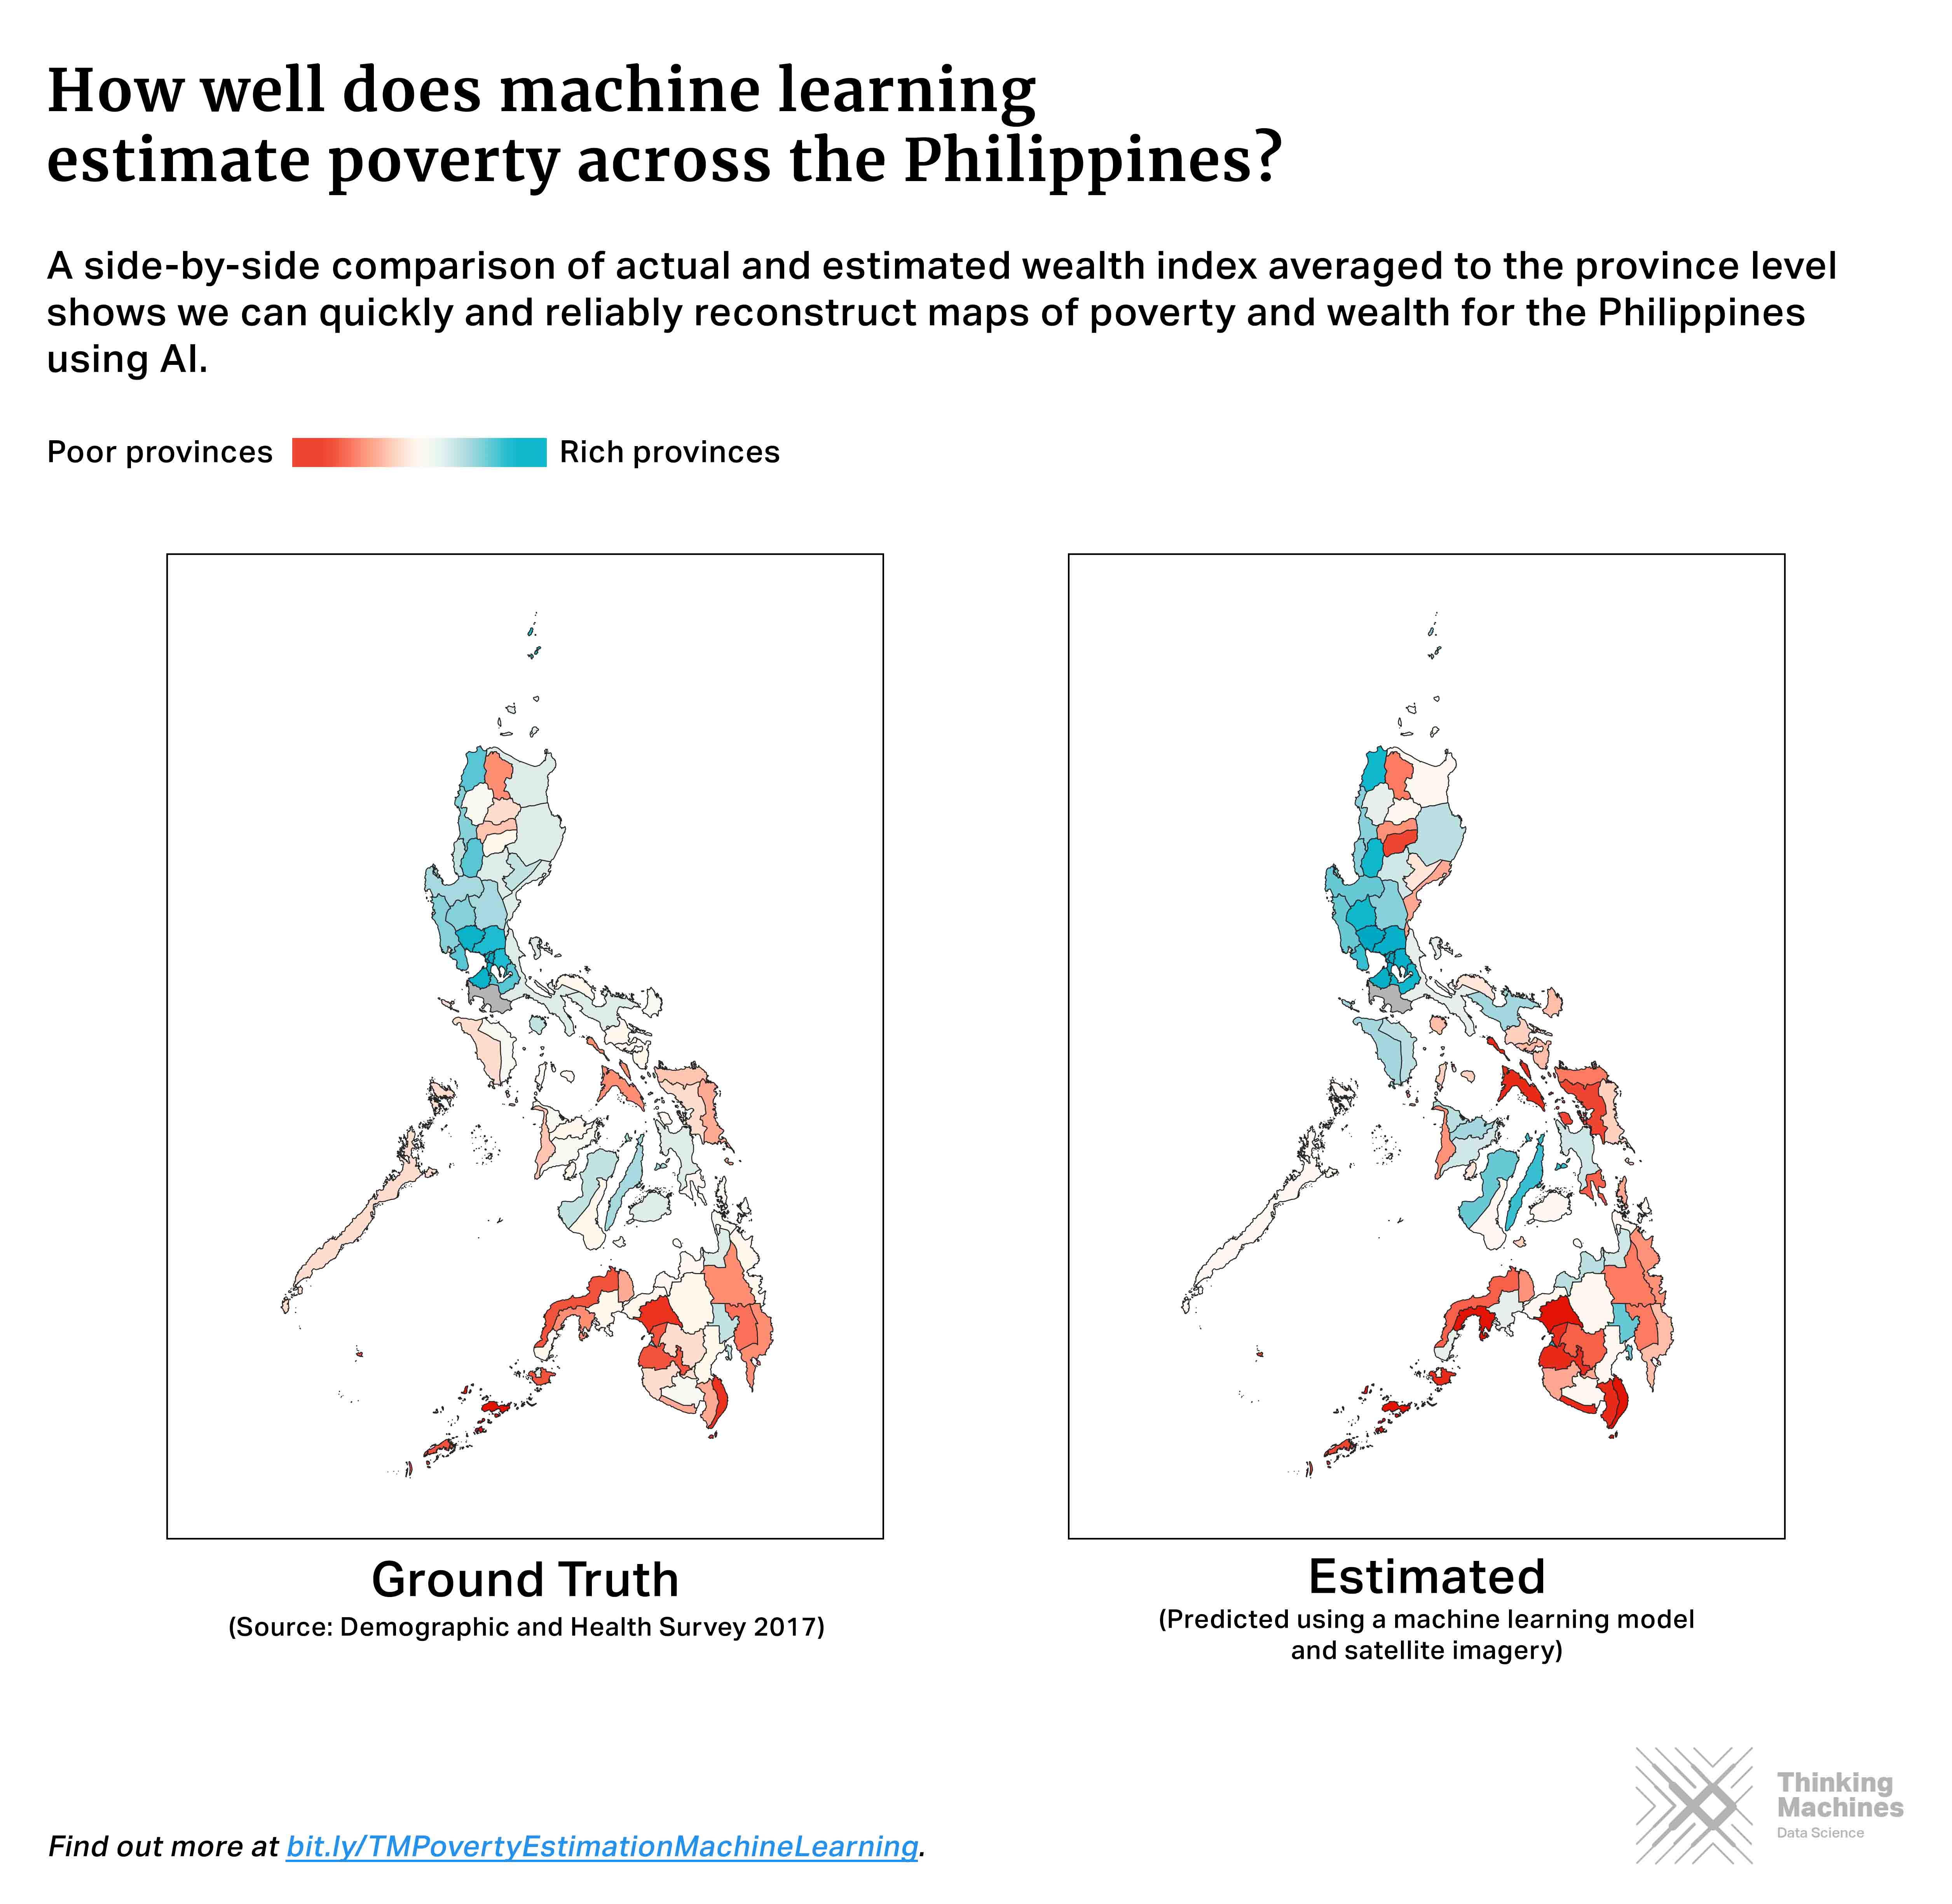
Apart from wealth, we also looked into estimating other socioeconomic indicators such as years of education, access to electricity, and access to water. We present our resulting wealth estimates, aggregated to the province level.

Poverty Prediction using Transfer Learning
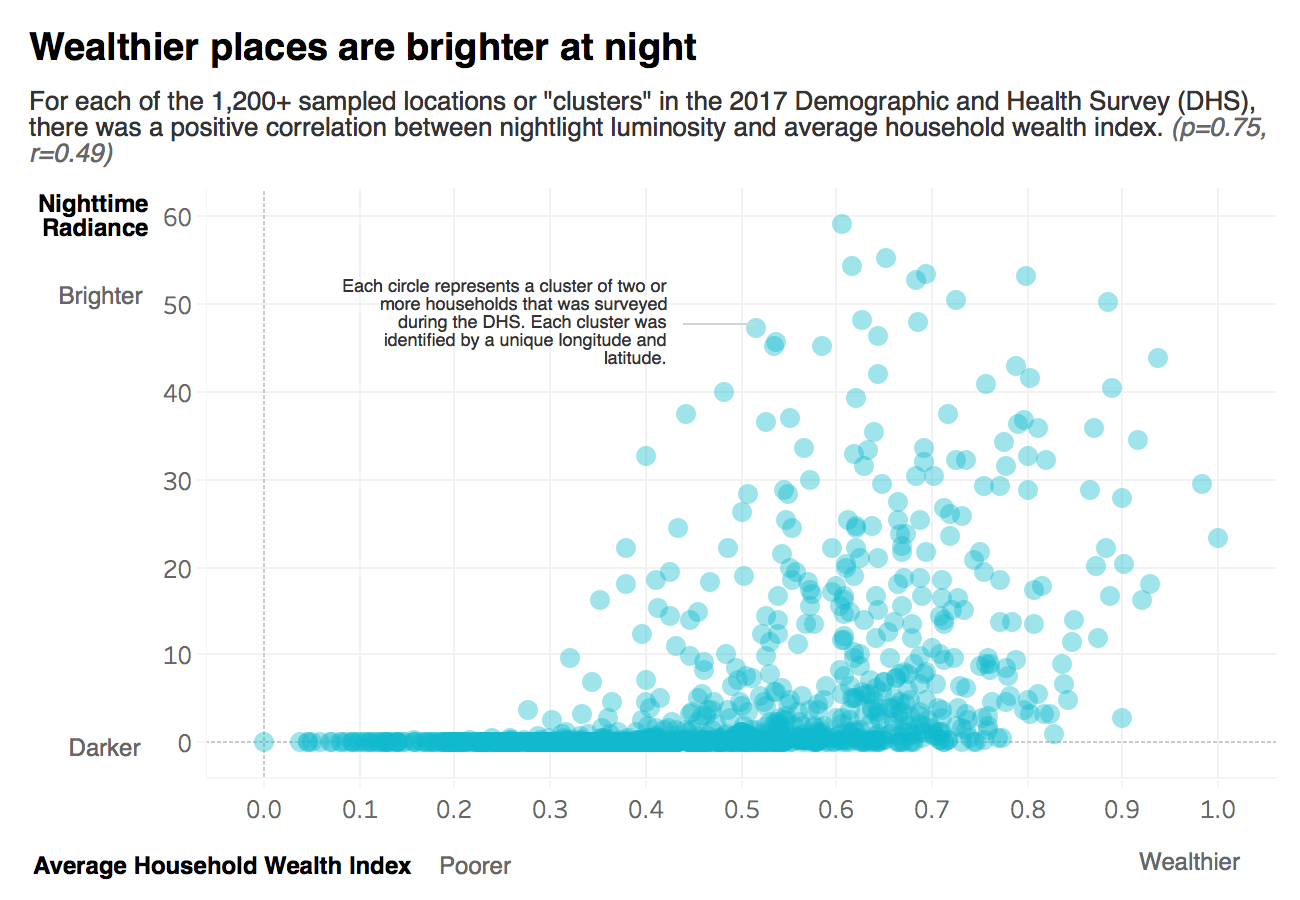
Because more urbanized and developed areas tend to give off more light at night, nighttime lights as seen from space act as an excellent proxy for economic development. Following the works of Jean et al., we leveraged transfer learning, a type of machine learning technique, in order to map daytime satellite images to nighttime light luminosity levels. Transfer learning involves taking knowledge gained from learning a simple task and applying it to learn a more complex but related task. It can be likened to learning to ride a bicycle (simple task) and applying the same skills you’ve gained to maneuver a motorcycle (complex task).
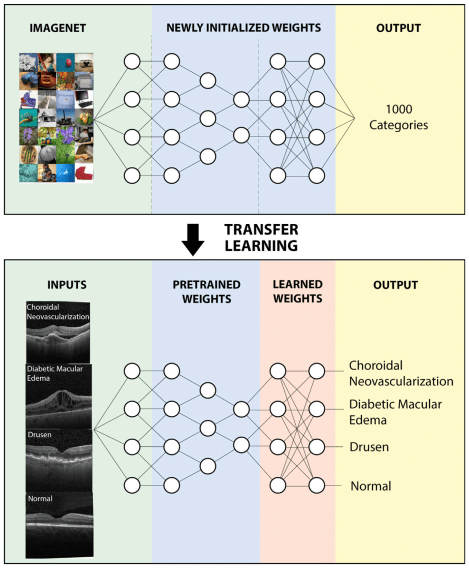
More technically, we took the weights learned by a convolutional neural network (CNN) pre-trained to recognize a thousand different ImageNet classes and “transferred” them to a model which we then trained to distinguish between different levels of night light intensities given the corresponding daytime satellite image. After fine-tuning the model, we extracted for each daytime satellite image a 4,096-dimensional feature vector representing identified patterns that differentiate between low, medium, and high nighttime light luminosity.

Schematic depiction of the application of transfer learning in medical diagnoses.
Source: Identifying Medical Diagnoses and Treatable Diseases by Image-Based Deep Learning
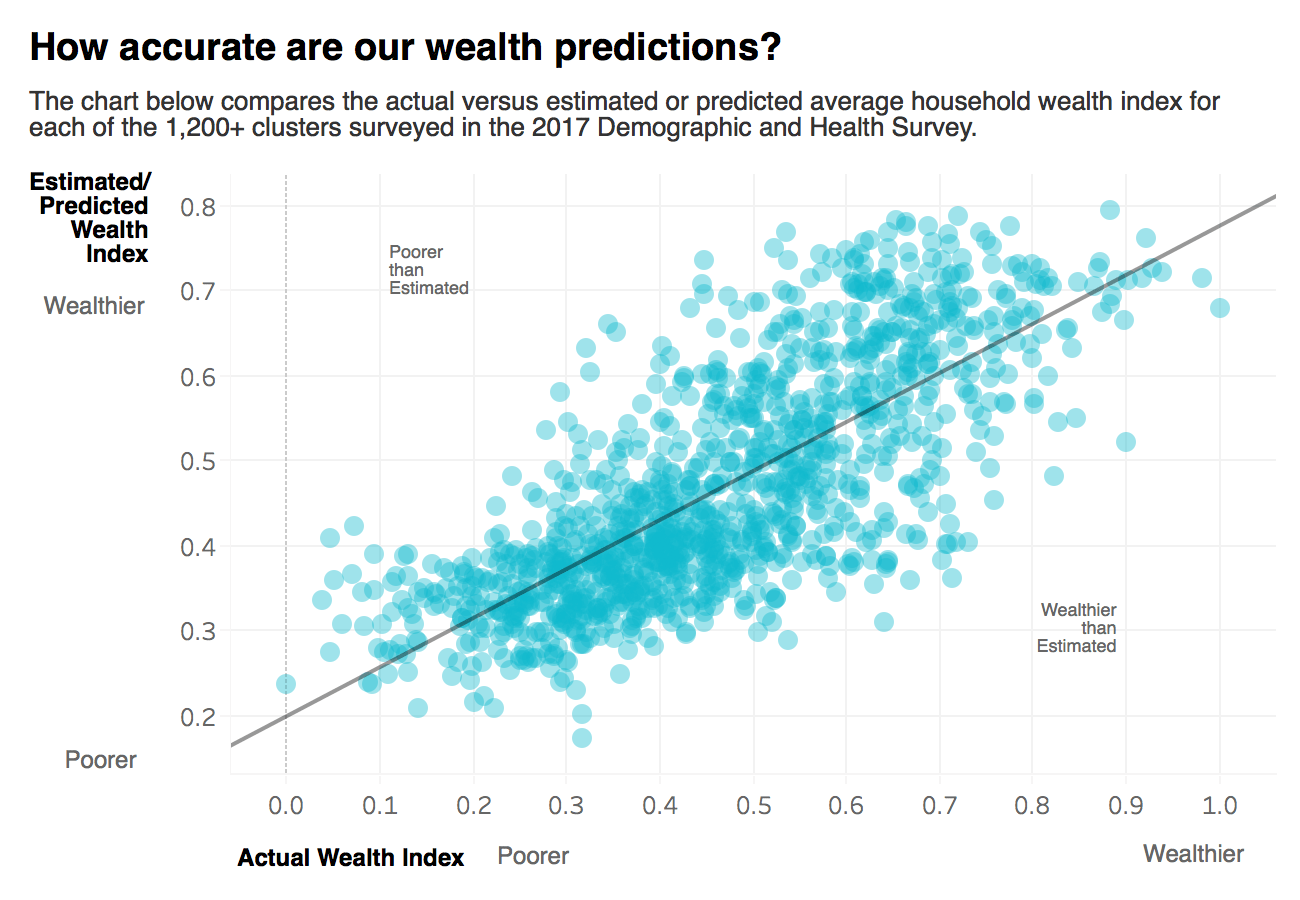
We compared the performance of ridge regression models trained on image features derived from the fine-tuned CNN model against models trained only on nighttime lights. We found that using features engineered from nightlights alone, the ridge regression model can explain only 29% of the variance in wealth. However, using Jean et al.’s transfer learning approach, the model was able to explain up to 56% of variance in wealth. For context, previous studies have achieved r-squared results ranging from 0.51 - 0.75 for countries including Malawi, Nigeria, Tanzania, Rwanda, Haiti, and Nepal.


What's next?
Combining machine learning techniques with geospatial data provides new opportunities for faster, cheaper, and more scalable estimations of poverty. But the methods we've explored using so far can still be improved greatly.
For example, using nighttime lights is useful for telling between places that are rich or poor, but less useful for distinguishing between places that are poor and very poor, especially in far-flung areas with little to no access to electricity.
Nighttime lights is also not an ideal proxy for other important human development indicators aside from wealth – such as child malnutrition or literacy.
Nonetheless, our preliminary results only bolster the fact that poverty estimation using machine learning is a promising area of research with large potential societal impact.
We’re continually working to improve our poverty prediction models; as of writing, we have been able to reconstruct wealth with an r-squared of 62% using a semi-automated approach. We’ll be sharing more details about our progress in future blog posts, so stay tuned.
How can our team help you get insights from data? Send us a message below and we'll contact you to set up a conversation:


